12.2 Comparisons
How does filter() use logical vectors?
-
filter()takes these TRUE/FALSE values and keeps only the rows where the condition is TRUE. -
So, when you write:
flights |>
  filter(dep_time > 600 & dep_time < 2000 & abs(arr_delay) < 20)
You’re saying:
-
Keep flights that left during the day (6:01 AM to 7:59 PM),
-
AND arrived within 20 minutes of the scheduled time (either early or late).
-
-
Shortcut: You can put the logic right inside
filter(). -
But: This logic is “invisible”—it’s used once and then discarded.
Why Use mutate() to Create Logical Variables?
With mutate(), you name your logical variables and make them visible in your data.
flights |>
  mutate(
    daytime = dep_time > 600 & dep_time < 2000,
    approx_ontime = abs(arr_delay) < 20,
    .keep = "used"
)-
daytime: TRUE if flight left during the day. -
approx_ontime: TRUE if flight arrived within 20 minutes of scheduled time.
Now, every row will have these new columns:
-
Easy to check: Did you get the logic right?
-
Easy to reuse: No need to repeat the logic.
What does .keep = "used" do in mutate()?
-
By default, when you use
mutate(), it keeps all the columns in your data, plus any new columns you create. -
Sometimes, especially when you’re creating a lot of temporary variables, you might want to control which columns remain in your resulting data.
.keep = "used" means:
After the mutate, only keep the columns that were used to create the new variables, plus the new variables themselves.
Other .keep Options
-
.keep = "all"(default): Keep all columns (old and new). -
.keep = "used": Keep only columns used to compute the new columns, plus the new columns. -
.keep = "unused": Keep only columns not used to compute the new columns, plus the new columns. -
.keep = "none": Only the new columns remain.
Why is This Useful?
-
Clarity: Naming logic makes your code easier to understand (“self-documenting”).
-
Debugging: You can check if your logic works as expected.
-
Complexity: For multi-step logic, breaking it up with named columns avoids mistakes and confusion.
Equivalent Code, More Readable
Compare:
flights |>
  filter(dep_time > 600 & dep_time < 2000 & abs(arr_delay) < 20)
vs.
flights |>
  mutate(
    daytime = dep_time > 600 & dep_time < 2000,
    approx_ontime = abs(arr_delay) < 20
  ) |>
  filter(daytime & approx_ontime)
Result is the same, but the second version is easier to read, check, and extend.
12.2.1 Floating point comparison
Beware of using == with numbers. For example, it looks like this vector contains the numbers 1 and 2:
x <- c(1 / 49 * 49, sqrt(2) ^ 2)
x
#> [1] 1 2
But if you test them for equality, you get FALSE:
x == c(1, 2)
#> [1] FALSE FALSE
What’s going on? Computers store numbers with a fixed number of decimal places so there’s no way to exactly represent 1/49 or sqrt(2) and subsequent computations will be very slightly off. We can see the exact values by calling [print() with the digits argument:
print(x, digits = 16)
#> [1] 0.9999999999999999 2.0000000000000004
You can see why R defaults to rounding these numbers; they really are very close to what you expect.
Now that you’ve seen why == is failing, what can you do about it? One option is to use dplyr::near()which ignores small differences:
near(x, c(1, 2))
#> [1] TRUE TRUE
12.2.2 Missing values
Missing values represent the unknown so they are “contagious”: almost any operation involving an unknown value will also be unknown:
NA > 5
#> [1] NA
10 == NA
#> [1] NA
The most confusing result is this one:
NA == NA
#> [1] NA
It’s easiest to understand why this is true if we artificially supply a little more context:
# We don't know how old Mary is
age_mary <- NA

# We don't know how old John is
age_john <- NA

# Are Mary and John the same age?
age_mary == age_john
#> [1] NA
# We don't know!
So if you want to find all flights where dep_time is missing, the following code doesn’t work because dep_time == NA will yield NA for every single row, and filter() automatically drops missing values:
flights |>
  filter(dep_time == NA)
#> # A tibble: 0 × 19
#> # ℹ 19 variables: year <int>, month <int>, day <int>, dep_time <int>,
#> #   sched_dep_time <int>, dep_delay <dbl>, arr_time <int>, …
Instead we’ll need a new tool: is.na().
12.2.3 is.na()
is.na(x) works with any type of vector and returns TRUE for missing values and FALSE for everything else
We can use is.na() to find all the rows with a missing dep_time:
flights |>
  filter(is.na(dep_time))
#> # A tibble: 8,255 × 19
#>    year month   day dep_time sched_dep_time dep_delay arr_time sched_arr_time
#>   <int> <int> <int>    <int>          <int>     <dbl>    <int>          <int>
#> 1  2013     1     1       NA           1630        NA       NA           1815
#> 2  2013     1     1       NA           1935        NA       NA           2240
#> 3  2013     1     1       NA           1500        NA       NA           1825
#> 4  2013     1     1       NA            600        NA       NA            901
#> 5  2013     1     2       NA           1540        NA       NA           1747
#> 6  2013     1     2       NA           1620        NA       NA           1746
#> # ℹ 8,249 more rows
#> # ℹ 11 more variables: arr_delay <dbl>, carrier <chr>, flight <int>, …
is.na() can also be useful in arrange(). arrange() usually puts all the missing values at the end but you can override this default by first sorting by is.na()
flights %>%
  filter(
    month == 1,day == 1
  ) %>%
arrange(desc(is.na(dep_time)))-
is.na(dep_time)returns TRUE ifdep_timeis missing, FALSE otherwise. -
desc(is.na(dep_time))puts all the rows wheredep_timeis NA (missing) first (sincedesc(TRUE)>desc(FALSE)). -
No further sorting—within those groups, the order is arbitrary.
Second Code:
flights %>%
  filter(
    month == 1,day == 1
  ) %>%
arrange(desc(is.na(dep_time)),dep_time)-
This also puts all missing
dep_timerows first. -
But: Within each group (missing or not missing), it further sorts by
dep_time(from lowest to highest, because default is ascending). -
So for non-missing
dep_timevalues, you get a chronological order.
In Simple Terms:
| Code | Sorting Priority |
|---|---|
arrange(desc(is.na(dep_time))) | 1. Missing first (order within each group = random) |
arrange(desc(is.na(dep_time)), dep_time) | 1. Missing first 2. If not missing, sort by time (earliest to latest) |
12.2.4 Exercises
Use mutate(), is.na(), and count() together to describe how the missing values in dep_time, sched_dep_time and dep_delay are connected
It’s asking you to explore and summarize how the missing values in dep_time, sched_dep_time, and dep_delay are related.
For example: If a row is missing dep_time, is it also missing the other two? Are the missingness patterns always the same, or do they differ?
> flights %>%
+   mutate(
+     miss_dep_time = is.na(dep_time),
+     miss_sched_dep_time = is.na(sched_dep_time),
+     miss_dep_delay = is.na(dep_delay)
+   ) %>%
+   count(miss_dep_time,miss_sched_dep_time,miss_dep_delay)
# A tibble: 2 × 4
  miss_dep_time miss_sched_dep_time miss_dep_delay      n
  <lgl>         <lgl>               <lgl>           <int>
1 FALSE         FALSE               FALSE          328521
2 TRUE FALSE TRUE 8255-
miss_dep_time == TRUE:dep_timeis missing -
miss_sched_dep_time == FALSE:sched_dep_timeis not missing -
miss_dep_delay == TRUE:dep_delayis missing -
n = 8,255: There are 8,255 flights where both the actual departure time (
dep_time) and the departure delay (dep_delay) are missing, but the scheduled departure time (sched_dep_time) is present.
How are the Missing Values Connected?
-
Whenever
dep_timeis missing,dep_delayis also missing.
(You never see a row where one is missing and the other isn’t.) -
sched_dep_timeis never missing (always FALSE for this variable), no matter what happens to the other two. -
Most rows (the vast majority) have no missing values at all.
12.3 Boolean algebra
12.3.3 %in%
An easy way to avoid the problem of getting your ==s and |s in the right order is to use %in%. x %in% y returns a logical vector the same length as x that is TRUE whenever a value in x is anywhere in y .
flights %>%
  filter(month %in% c(11,12))
Note that %in% obeys different rules for NA to ==, as NA %in% NA is TRUE.
> c(1,2,NA) %in% (NA)
[1] FALSE FALSE  TRUE
> c(1,2,NA) == (NA)
[1] NA NA NA
12.3.4 Exercises
Assuming that a missing dep_time implies that a flight is cancelled, look at the number of cancelled flights per day. Is there a pattern? Is there a connection between the proportion of cancelled flights and the average delay of non-cancelled flights?
flights %>%
  mutate(
    cancelled = is.na(dep_time)
  ) %>%
  group_by(year, month, day) %>%
  summarise(
    cancelled_flights = sum(cancelled),
    total_flights = n(),
    proportion_cancelled = cancelled_flights / total_flights,
    avg_dep_delay = mean(dep_delay[!cancelled], na.rm = TRUE) #this is clever
  ) %>%
  ggplot(aes(x = proportion_cancelled, y = avg_dep_delay)) +
  geom_point() +
  geom_smooth()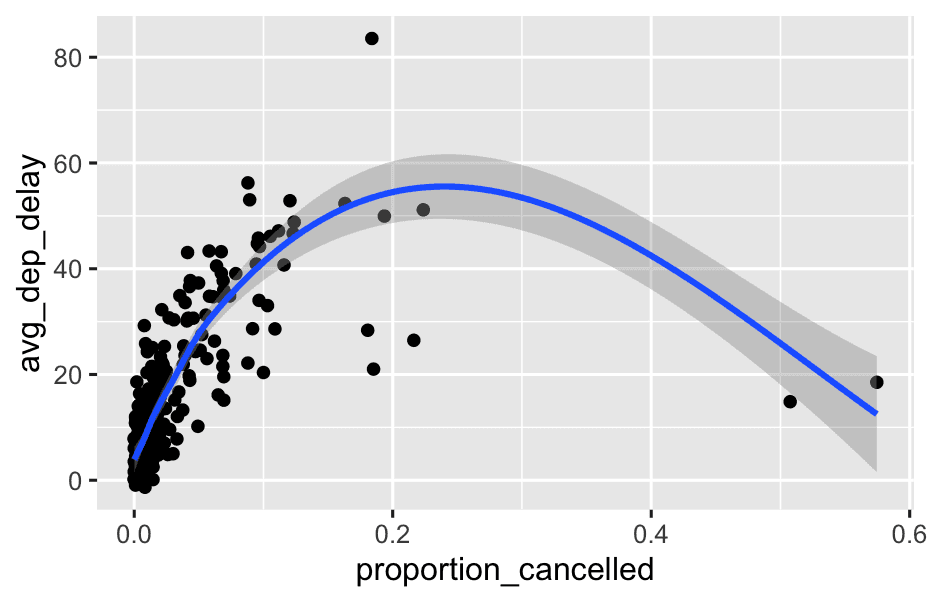
- Inside a grouped summary,
n()always counts rows per group. - If not grouped,
n()counts all rows in the data. - In the
flightsdataset, each row is a flight. - So, after you group by day,
n()gives you the number of flights that happened (or were scheduled) that day.
12.4 Summaries
12.4.1 Logical summaries
flights |>
  group_by(year, month, day) |>
  summarize(
    all_delayed = all(dep_delay <= 60, na.rm = TRUE),
    any_long_delay = any(arr_delay >= 300, na.rm = TRUE),
    .groups = "drop"
  )
#> # A tibble: 365 × 5
#>    year month   day all_delayed any_long_delay
#>   <int> <int> <int> <lgl>       <lgl>
#> 1  2013     1     1 FALSE       TRUE
#> 2  2013     1     2 FALSE       TRUE
#> 3  2013     1     3 FALSE       FALSE
#> 4  2013     1     4 FALSE       FALSE
#> 5  2013     1     5 FALSE       TRUE
#> 6  2013     1     6 FALSE       FALSE
#> # ℹ 359 more rows
a. all_delayed = all(dep_delay <= 60, na.rm = TRUE)
-
all()checks if every value in the group meets a condition. -
Here, it asks: “Were all flights that day delayed by at most 60 minutes?”
-
If yes (all flights ≤ 60 min delay), it returns
TRUE. -
If any flight that day had a delay > 60 min, it returns
FALSE.
-
-
na.rm = TRUEtells R to ignore missing values when doing this check.
b. any_long_delay = any(arr_delay >= 300, na.rm = TRUE)
-
any()checks if at least one value in the group meets a condition. -
Here, it asks: “Did any flight that day arrive at least 300 minutes late (5 hours)?”
-
If yes (even just one flight), returns
TRUE. -
If none, returns
FALSE.
-
-
Again,
na.rm = TRUEignores missing values.
c. .groups = "drop"
- After summarizing, this removes the groupings so the result is just a plain data frame.
12.4.2 Numeric summaries of logical vectors
flights |>
  group_by(year, month, day) |>
  summarize(
    proportion_delayed = mean(dep_delay <= 60, na.rm = TRUE),
    count_long_delay = sum(arr_delay >= 300, na.rm = TRUE),
    .groups = "drop"
  )
#> # A tibble: 365 × 5
#>    year month   day proportion_delayed count_long_delay
#>   <int> <int> <int>              <dbl>            <int>
#> 1  2013     1     1              0.939                3
#> 2  2013     1     2              0.914                3
#> 3  2013     1     3              0.941                0
#> 4  2013     1     4              0.953                0
#> 5  2013     1     5              0.964                1
#> 6  2013     1     6              0.959                0
#> # ℹ 359 more rows
sum(x) gives the number of TRUEs and mean(x) gives the proportion of TRUEs (because mean() is just sum() divided by length()).
12.4.3 Logical subsetting
flights %>%
  group_by(year, month, day) %>%
  summarise(
    behind = mean(arr_delay > 0,na.rm = TRUE),
    ahead = mean(arr_delay < 0,na.rm = TRUE),
    total_number_filights = n(),
    .groups = 'drop'
)- Group by year, month, day
group_by(year, month, day)
- This means: “Look at all flights for each calendar day.”
- Summarize:
a. behind = mean(arr_delay[arr_delay > 0], na.rm = TRUE)
-
Looks at all flights that arrived late (
arr_delay > 0) for that day. -
Calculates their average arrival delay.
-
na.rm = TRUEmeans any missing values are ignored. -
If no flights arrived late that day, the mean will be NA.
b. ahead = mean(arr_delay[arr_delay < 0], na.rm = TRUE)
-
Looks at all flights that arrived early (
arr_delay < 0). -
Calculates their average “earliness” (i.e., how early, in minutes, flights arrived).
-
Will be a negative number if there are early arrivals.
-
Again, if no flights arrived early, the mean will be NA.
c. n = n()
- Counts total number of flights that day.
d. .groups = “drop”
- Removes groupings in the result (so the output is just a regular data frame).
12.4.4 Exercises
- What will
sum(is.na(x))tell you? How aboutmean(is.na(x))?
mean(is.na(x))
-
What does it do?
-
Again,
is.na(x)gives TRUE (1) for NAs, FALSE (0) otherwise. -
mean()computes the average value (sum divided by number of elements).
-
-
What does it tell you?
- The proportion (fraction) of values in
xthat are missing.
- The proportion (fraction) of values in
Example:
x <- c(1, 2, NA, 4, NA)
mean(is.na(x))  # Output: 0.4
Interpretation: 40% of the values in
xare missing (2 out of 5).
Summary Table
| Expression | What it tells you |
|---|---|
sum(is.na(x)) | Number of missing values in x |
mean(is.na(x)) | Proportion (fraction) of missing values in x |
12.5 Conditional transformations
12.5.2 case_when()
> x <- c(-3:3, NA)
> case_when(
+   x == 0 ~ '0',
+   x < 0 ~ '-ve',
+   x > 0 ~ '+ve',
+   is.na(x) ~'xxx'
+ )
[1] "-ve" "-ve" "-ve" "0"   "+ve" "+ve" "+ve" "xxx"
>
Use .default if you want to create a “default”/catch all value:
case_when(
  x < 0 ~ '-ve',
  x > 0 ~ '+ve',
  .default = 'xxx'
)
Just like with if_else() you can use variables on both sides of the ~ and you can mix and match variables as needed for your problem. For example, we could use [case_when()] to provide some human readable labels for the arrival delay:
flights |>
  mutate(
    status = case_when(
      is.na(arr_delay)      ~ "cancelled",
      arr_delay < -30       ~ "very early",
      arr_delay < -15       ~ "early",
      abs(arr_delay) <= 15  ~ "on time",
      arr_delay < 60        ~ "late",
      arr_delay < Inf       ~ "very late",
    ),
    .keep = "used"
  )
Write a case_when() statement that uses the month and day columns from flights to label a selection of important US holidays (e.g., New Years Day, 4th of July, Thanksgiving, and Christmas). create a character column that either gives the name of the holiday or is NA.
flights <- flights %>%
  mutate(
    holiday = case_when(
      month == 1 & day == 1 ~ "New Year’s Day",
      month == 7 & day == 4 ~ "Independence Day",
      month == 12 & day == 25 ~ "Christmas",
      .default = 'NA'
    )
  )